A 2026 benchmarking and regulatory guide for orthopedic practice administrators, surgeons, revenue cycle directors, and physician-group financial leaders.
Executive Summary
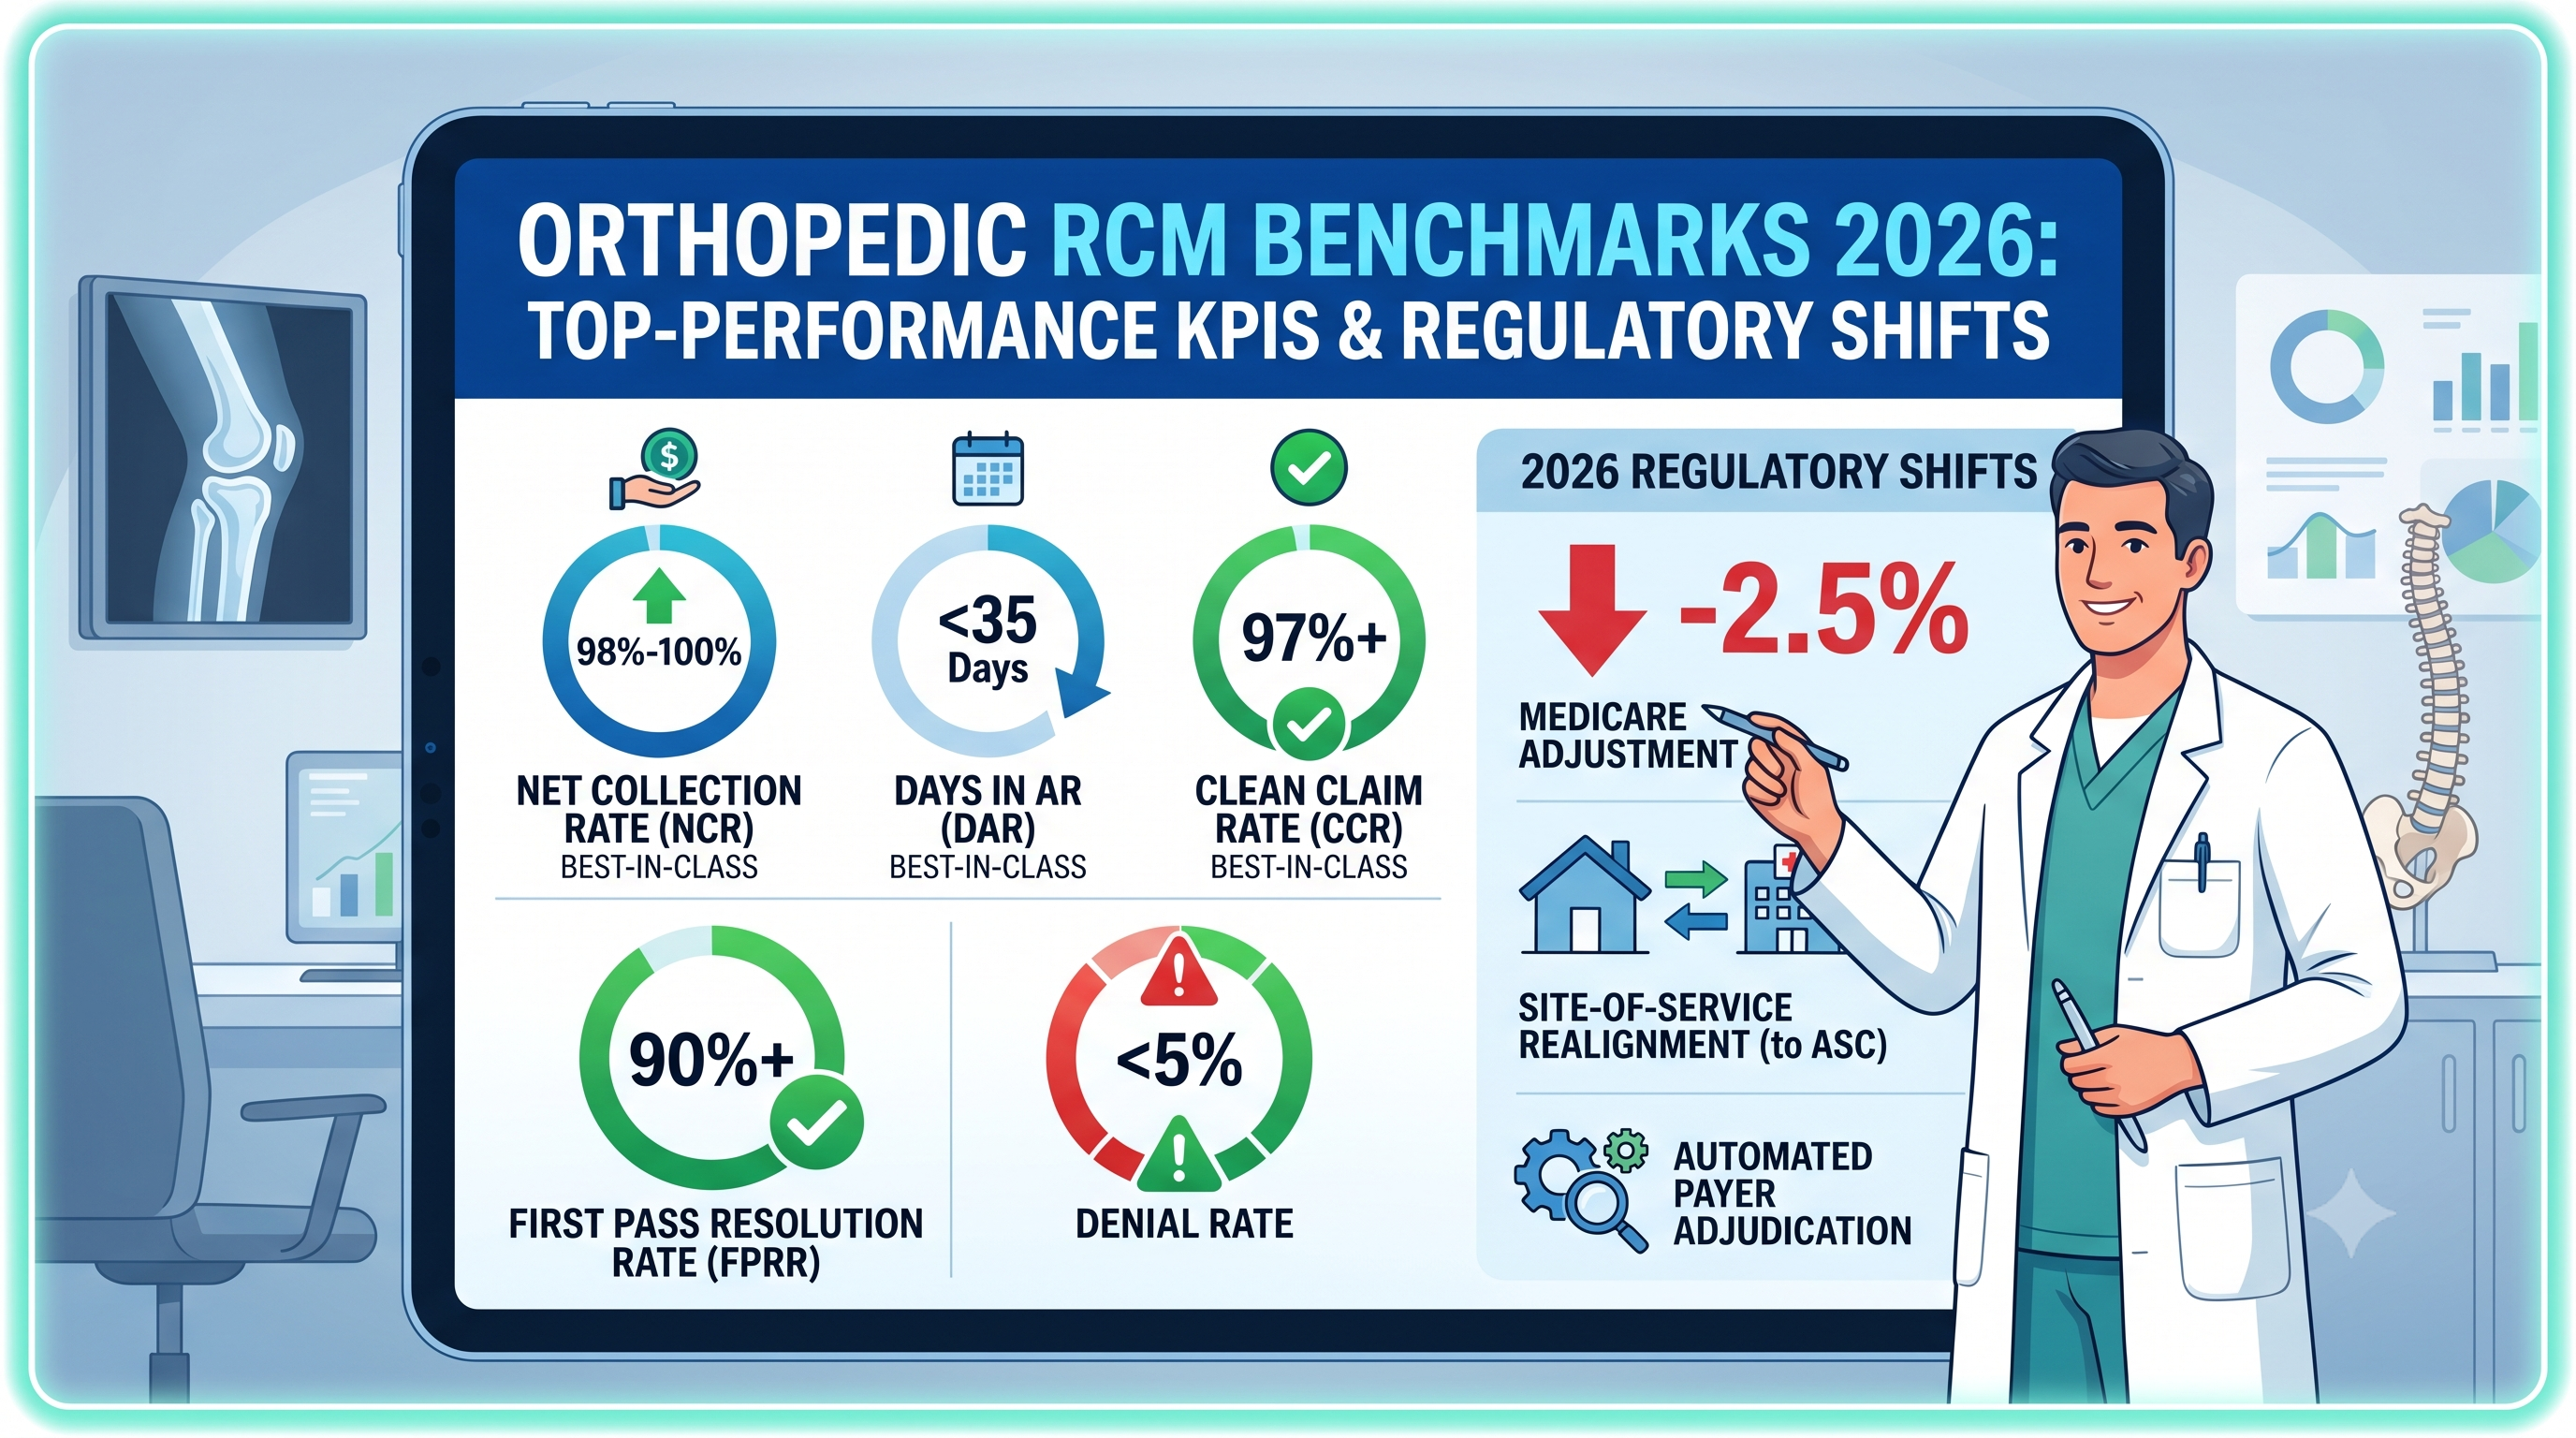
Three regulatory shifts converged on January 1, 2026, and each one compounds the financial penalty for coding ambiguity and slow workflows. Orthopedic practices are absorbing a –2.5% Medicare work-RVU efficiency adjustment, a site-of-service practice-expense realignment that penalizes hospital-based surgery, and compressed prior-authorization timelines that have pushed automated payer adjudication and initial denial rates past 10%. In a specialty where surgery drives 80% to 90% of revenue, those pressures stack — and the practices that stay profitable treat revenue cycle management as a strategic asset, not a back office.
The defining macro-theme of 2026: per-case profitability is compressing even as headline conversion factors rise.
The CY 2026 conversion factors increased to $33.57 for qualifying APM participants and $33.40 for non-QPs — but because the –2.5% efficiency adjustment lands on the base work RVUs of the surgical, interventional-pain, and imaging codes that anchor orthopedic revenue, the net weighted impact for orthopedic providers is closer to a 1.5% decrease. The controllable levers, not the fee schedule, decide who stays in the top decile.
The six developments orthopedic leaders must act on:
1. The efficiency adjustment quietly cuts surgical revenue. For a practice generating $5 million in Medicare-allowable surgical charges, the wRVU compression represents a baseline annual reduction of $125,000 before any denials or billing errors. Time-based codes — E/M, care management, behavioral health — are exempt, a clear policy tilt toward cognitive care over procedural work.
2. Site-of-service realignment penalizes facility settings. General orthopedic surgery takes one of the steepest facility practice-expense cuts (–6.9%, roughly $39,653 per FTE), accelerating case migration to ASC and outpatient settings — where a single site-of-service mismatch between the authorization and the place of service triggers an automated denial that is costly to overturn.
3. Manage to FPRR, not clean claim rate. A claim can pass every formatting edit and still be denied for authorization, medical necessity, or eligibility. First Pass Resolution Rate tracks claims all the way to payment; target 90%+ (95%+ best-in-class) and treat CCR as an upstream control, not the finish line.
4. The write-off trap can hide six-figure losses. When administrative write-offs are misclassified as contractual adjustments, the net-charges denominator shrinks, and NCR inflates toward 100% on claims that collected nothing — an error estimated to cost 3% to 5% of annual collectible revenue. Monitor the adjustment-to-charge ratio (40%–55% for a commercial-heavy mix) as the trip wire.
5. CPT 2026 demands immediate template surgery. The set carries 418 changes concentrated in musculoskeletal and spinal services. Retire deleted code 27445 now — it rejects automatically — and master the 27278 vs. 27279 SI-joint distinction, where a single anatomical fact (cortical piercing) determines the payment level.
6. Documentation discipline is the path to gold-carding. Practices that sustain prior-auth approval rates at or above 90% can qualify for gold-card status, bypassing standard authorization on qualifying procedures — turning clinical documentation into a competitive advantage.
Three priorities for the next quarter: (1) shift performance benchmarks from CCR to FPRR and audit the baseline gap between them; (2) deploy a payer-specific modifier validation mechanism and a 24-hour chart-completion standard; and (3) build a pre-service clinical validation workflow that attaches date-, dosage-, and duration-specific conservative-treatment evidence to every elective-surgery authorization.
Orthopedic RCM 2026, By the Numbers
In This Article
- What Is Driving 2026 Reimbursement Compression
- The Seven Must-Track Orthopedic KPIs
- How the Core Metrics Are Calculated
- Why FPRR Is the Gold Standard
- The Write-Off Trap
- CPT 2026 Coding Changes
- Top Denial Reasons & Prevention
- Using HFMA MAP Keys
- Segmenting AR by Payer & Provider
- The Four Revenue-Integrity Mandates
- Urgent vs. Emerging
- Executive Checklist
- Frequently Asked Questions
- The Bottom Line
What Is Driving the 2026 Reimbursement Compression in Orthopedic Revenue
Three regulatory shifts converged on January 1, 2026, and each one compounds the financial impact of coding ambiguity and slow workflows. Understanding them is the context for every benchmark that follows.
The –2.5% Efficiency Adjustment
CMS's CY 2026 Physician Fee Schedule Final Rule (CMS-1832-F) applies a –2.5% efficiency adjustment directly to the work RVUs and intra-service time of most non-time-based codes — the surgical, interventional-pain, and imaging-interpretation services that drive orthopedic revenue. Because the cut lands on the base wRVUs rather than the conversion factor, it deflates RVU generation and erodes per-case profitability even as the headline conversion factors rise.
| Participant Category | CY 2025 CF | CY 2026 CF | Change |
|---|---|---|---|
| Qualifying APM Participants (QPs) | $32.35 | $33.57 | +3.77% |
| Non-Qualifying Clinicians (Non-QPs) | $32.35 | $33.40 | +3.26% |
Those increases mislead when viewed in isolation. The one-year 2.5% statutory bump under the One Big Beautiful Bill Act (P.L. 119-21) plus a 0.49% budget-neutrality adjustment lift the conversion factors, but because the efficiency adjustment targets the surgical, interventional-pain, and imaging codes that anchor orthopedic revenue, the net weighted wRVU impact for orthopedic providers lands closer to a 1.5% decrease. The practical math is stark: for a practice generating $5 million in Medicare-allowable surgical charges, the wRVU compression is a baseline $125,000 annual reduction before any denial or billing error. Time-based codes — E/M, care management, behavioral health — are exempt.
The Site-of-Service Practice-Expense Realignment
In parallel, CMS shifted indirect practice-expense (PE) RVUs toward office-based settings (Place of Service 11) and cut facility-setting PE — permanently reducing facility PE RVUs allocated on work RVUs to half the non-facility amount, on the rationale that hospitals already bear those administrative costs. General orthopedic surgery takes one of the steepest facility-setting reductions.
| Specialty Setting | Facility Change | Facility $/FTE | Non-Facility Change | Non-Facility $/FTE |
|---|---|---|---|---|
| Orthopedic Surgery – General | –6.9% | ($39,653) | –0.3% | ($2,195) |
| Cardiothoracic Surgery | –3.2% | ($16,478) | –0.9% | ($4,560) |
| General Surgery | –4.9% | ($19,192) | +3.6% | $16,464 |
| Gastroenterology | –7.4% | ($33,453) | +12.7% | $105,975 |
| Dermatology | –10.6% | ($49,917) | +4.6% | $32,617 |
The CY 2026 OPPS/ASC final rule materially strengthens the site-of-service shift for orthopedic and musculoskeletal procedures. CMS finalized the removal of 285 mostly musculoskeletal procedures from the Inpatient-Only list as the first step in a three-year phase-out, with full elimination of IPO expected by January 1, 2029. The rule also expands the ASC Covered Procedures List by 560 procedures — 289 added through revised ASC-CPL criteria and 271 added after removal from the IPO list — and applies a 2.6% ASC payment update for qualifying ASCs using the hospital market basket methodology for CY 2026. Together, these changes increase the number of orthopedic procedures that may be clinically and financially viable in hospital outpatient or ASC settings, though site-of-service decisions must still be based on patient risk, physician judgment, payer policy, and facility capability.
⚠ The most common new leak: site-of-service mismatch
A prior authorization secured for an inpatient setting (POS 21), while the procedure is performed in an ASC (POS 24), triggers an immediate automated denial that is exceptionally difficult and costly to overturn through a retroactive appeal. Middle-revenue-cycle teams should hardcode automated cross-checks that reconcile the scheduled service location against the active authorization 24 to 48 hours before incision. Missing implant charges and un-renegotiated commercial contracts compound the loss.
Compressed Prior-Auth Timelines and Payer Automation
The CMS-0057-F Interoperability and Prior Authorization Final Rule (operational provisions effective January 1, 2026) requires impacted federally funded payers — Medicare Advantage, Medicaid managed care, and CHIP managed care — to decide complete prior-auth requests within 72 hours for urgent cases and 7 calendar days for standard ones, with specific, traceable denial reasons regardless of submission method. Public metrics reporting begins March 31, 2026, and FHIR-based Prior Authorization APIs are required by January 1, 2027.
To meet those compressed windows, commercial payers have leaned heavily on automated adjudication, which rejects complex orthopedic claims at high rates. A widely reported civil case centered on one major commercial insurer's automated review system, which a 2023 ProPublica investigation found had denied more than 300,000 claims over two months in 2022, with medical directors averaging just 1.2 seconds of review per file. (The insurer characterized that system as rules-based software rather than artificial intelligence.) Nationally, 41% of providers already report initial denial rates of 10% or higher. On a surgery-heavy orthopedic book, a sustained 10% rate can equal $25,000 to $100,000 in lost or delayed revenue per physician per year — which is why front-end denial management is now a margin issue, not a clerical one.
The Seven Must-Track Orthopedic RCM KPIs in 2026
These seven KPIs, structured against HFMA MAP Key domains and MGMA/HBMA standards, form the objective baseline. The best-in-class column reflects top-decile performance — the target high performers actually hit, not merely "acceptable."
| KPI | Best Practice (Top Performers) | Industry Average / Threshold | HFMA MAP Domain |
|---|---|---|---|
| Net Collection Rate (NCR) | 98%–100% | ~95% (improvement threshold) | Financial Management |
| Revenue Realization Rate (RRR) | 99%–100% (90 days in arrears) | 95%–98% | Billing Integrity |
| Days in AR (DAR) | < 35 days (elite < 30) | 35–45 days | Account Resolution |
| Billed A/R > 90 Days | < 10% | 15%–25% | Account Resolution |
| Clean Claim Rate (CCR) | 97%+ (elite 99%) | 85%–90% | Claims & Pre-Billing |
| First Pass Resolution Rate (FPRR) | 90%+ (elite 95%) | 80%–85% (< 75% needs review) | Claims & Pre-Billing |
| Denial Rate | < 5% (elite < 3%) | 9%–12% | Account Resolution |
How the Core Orthopedic Metrics Are Calculated — and What They Should Hit
Net Collection Rate (NCR)
NCR = total payments ÷ net charges (gross charges minus contractual adjustments). It measures the share of contractually allowed revenue you actually recover. Performance at or below 95% signals severe leakage — typically uncollected patient copays, uncollected patient balances, or failure to collect pre-surgical deposits for high-cost implants. Target 98%–100%. Because implants, biologics, and hardware carry high costs, a few points of slippage are worth six figures — and never trust NCR alone, since it is the metric most easily inflated by mis-booked write-offs. Disciplined patient-pay collection directly protects this number.

Revenue Realization Rate (RRR)
RRR = (total payments + all approved adjustments) ÷ total gross charges. It is an integrity check confirming every gross-charge dollar is accounted for by payment or a valid adjustment. Benchmark 99%–100%, calculated exactly 90 days in arrears — running it in real time distorts results because of payer adjudication lag. A rate below 99% points to charge-capture breakdowns: missing intraoperative guidance codes, undocumented clinical hardware, or unauthorized write-offs.
Days in Accounts Receivable (DAR)
DAR = total active billed AR ÷ average daily net patient service revenue, where the denominator is the most recent 90-day average per the HFMA MAP Key standard. Orthopedic DAR runs high due to multi-procedure surgical claims, heavy prior-authorization requirements, and Workers' Comp complexity. The average is 35–45 days; top performers reach under 35, elite under 30. Exclude patient credit balances, unbilled (DNFB) accounts, and bad debt already with collectors. The single most effective operational mechanism is reducing charge lag — finalize operative notes within 24 hours. The payoff is concrete: a 10-day DAR reduction frees roughly $137,000 in working capital per $5M in annual billing.
Billed A/R > 90 Days
Billed A/R > 90 = billed receivables aged beyond 90 days ÷ total active billed A/R, excluding unbilled (DNFB) accounts, bad debt with collectors, and credit balances. It isolates the "stuck" revenue most likely to become bad debt. Major reconstructions, spinal surgery, and trauma trigger audits, COB disputes, and prolonged Workers' Comp determinations — and WC claims aging past 180 days carry a significantly compounded permanent write-off risk, frequently estimated by industry analysts at 2% to 6% and heavily dependent on state jurisdiction. The HFMA standard is under 10%; up to 15% is tolerable for complex mixes, but over 25% demands an immediate back-end audit. Track self-pay A/R > 90 days separately, against its own higher threshold (under 30%).
Clean Claim Rate (CCR)
CCR = clean claims ÷ total submitted (passing formatting edits without manual intervention). It is a front-end formatting metric — demographic capture, eligibility, initial coding; common orthopedic failures are missing bilateral modifiers, mismatched place-of-service, and NCCI bundling. Target CCR 97%+ (elite 99%). But a clean claim is not a paid claim, which is why FPRR matters more.
Denial Rate
Denial Rate = denied claims ÷ total submitted. Track both the initial denial rate (front-end accuracy) and the final denial rate (permanent loss after appeals). Heavy modifier use and strict elective-surgery criteria push orthopedic initial denials as high as 15%. Best-in-class is under 5%; elite under 3%. Distinguish claim-level from line-item denials — a $50 line rejection can flag a $10,000 surgical encounter as "denied" and distort reporting.
Why FPRR Is the Gold Standard, Not Clean Claim Rate
First-pass resolution rate is the truer efficiency measure because it tracks claims all the way to payment, whereas the clean claim rate stops at submission. A claim can pass every formatting edit and still be denied for prior authorization, medical necessity, or eligibility. A well-configured scrubber can produce a high clean-claim rate while the practice still underperforms on first-pass resolution.
The gap usually reflects claims that cleared formatting but failed payer adjudication, were pended for more information, or required follow-up due to missing or mismatched authorizations, insufficient medical-necessity documentation, payer-specific rules, modifier issues, or laterality/diagnosis-procedure mismatches. Industry sources estimate that a substantial share of denied or returned claims are never resubmitted — commonly cited at around 35%, and in some reports as high as 60% — thereby converting preventable denials into permanent leakage. Manage to first-pass resolution with 90%+ as a practical target and 95%+ as best practice; treat CCR as an upstream control, not the finish line.
| Claim Processing Stage | Avg. Cost per Claim | Primary Expense Drivers |
|---|---|---|
| Initial electronic claim submission | $3–$6.50 | Varies by fully electronic vs. partially manual vs. all-in administrative cost |
| Claim rework / physician-practice appeal | ~$25.00 | Primarily staff labor and follow-up time |
| National average denial rework | $57–$103.00 | Varies by setting, payer mix, claim type, and clinical-labor overhead |
| Complex hospital-based claim appeal | ~$181.00 | Formal appeals, clinical documentation work, higher overhead |
Denials do not merely delay payment; they create avoidable administrative work. Premier has reported that added labor accounts for roughly 90% of provider claims-processing expense. A practice billing 500 surgical claims per month at a 10% denial rate generates 50 denied claims — at a $103 per-denial rework assumption, roughly $5,150 per month in rework cost before any claim ages out, is underpaid, or is written off. Front-end eligibility, authorization validation, documentation checks, and payer-specific edits are denial-prevention levers, not administrative nice-to-haves.
The Write-Off Trap: How a High NCR Can Mask Real Losses
When billing teams face backlogs of aged, denied claims, administrative write-offs may be inadvertently misclassified as contractual adjustments. This structural accounting error shrinks the net-charges denominator and artificially inflates NCR toward 100%, masking underlying revenue leakage — a structural accounting error that healthcare financial audits frequently estimate can cost practices 3% to 5% of annual collectible revenue.
Contractual adjustments are planned, legally binding reductions to the payer's allowed amount — not losses. Administrative write-offs are permanent losses from operational failure: timely-filing lapses, unapproved authorizations, and unworked denials. The three-row example shows how this misclassification produces a perfect-looking number from a total loss.
| Scenario | Billed | Contractual Adj. | Admin Write-Off | Cash Collected | Reported NCR |
|---|---|---|---|---|---|
| Standard surgical claim | $18,000 | $8,000 | $0 | $10,000 | 100% (true) |
| Denied — properly booked | $18,000 | $8,000 | $10,000 | $0 | 0% (true) |
| Denied — the write-off trap | $18,000 | $18,000* | $0 | $0 | 100% (inflated) |
*The $10,000 loss is misclassified into the contractual-adjustment column, zeroing out net charges and reporting an inflated 100% collection rate on a claim that collected nothing.
How to catch it
Monitor the adjustment-to-charge ratio — for a commercial-heavy orthopedic mix it should hold steady between 40% and 55% of gross charges. A sudden, unexplained spike means collectible claims are being written off. Enforce a governance rule: any non-contractual write-off above a threshold (e.g., $250) requires supervisor approval and documented justification.
What CPT 2026 Coding Changes Hit Orthopedics Hardest
The CPT 2026 set introduced 418 changes concentrated in musculoskeletal, spinal, and remote therapeutic monitoring services. Five updates demand immediate template revisions to avoid automated rejection. Aligning your coding templates to these now is the difference between clean adjudication and a backlog of preventable rejections.
| CPT Code | Procedure / Description | Key Coding Mandate | Exclusionary Bundling |
|---|---|---|---|
| 27458 (new) | Femoral osteotomy with externally controlled intramedullary lengthening device | All-inclusive: osteotomy, implant, imaging, alignment assessments, device-adjustment management | Expected to face severe NCCI exclusionary bundling; monitor edit pairs closely so it is not improperly billed alongside conflicting procedures such as 27450, 27466, 27470, 27472, or 27506 |
| 27713 (new) | Tibial (incl. fibula) osteotomy with intramedullary lengthening device | All-inclusive: imaging, alignment, device management; for limb-length discrepancy | Not billable with other tibia/fibula reconstruction codes, same session |
| 27278 (revised) | Percutaneous/MIS SI-joint arthrodesis; intra-articular device(s) | Device placed entirely within the joint space, WITHOUT piercing the ilium or sacrum cortices | Not billable with 27279 for the same SI joint |
| 27279 (revised) | Percutaneous/MIS SI-joint arthrodesis; transarticular device(s) | Device traverses the joint, PIERCING the cortices; now explicitly includes "hybrid" SI fusions | Not billable with 27278 for the same SI joint |
| 63032 (new add-on) | Annular defect repair with bone-anchored closure device, lumbar spine | Add-on code; reported once per session | Append to parent 63030; cannot be billed with 63042 |
| 1003T (new Cat III) | First carpometacarpal (CMC) joint arthroplasty with prosthetic replacement | Reports complete thumb-base reconstruction with prosthetic implant | Category III; requires individual MAC pricing |
| 27445 (DELETED) | Primary hinge prosthesis knee arthroplasty | Permanently deleted — clinically obsolete | Any submission generates automatic payer rejection |
The highest-risk change: the SI-joint pair
Because 27278 and 27279 carry different wRVU allocations (27279 is materially higher), miscoding a hybrid fusion that pierces cortical bone under the intra-articular code 27278 results in under-reimbursement, and the two can never be billed together for the same joint in a single session. Operative notes must be explicit about whether the device pierces the cortices, because that single anatomical fact determines the payment level. Retire 27445 from every template and charge sheet now; it will be rejected automatically.
Top Orthopedic Denial Reasons — and How to Prevent Them
Orthopedic denial rates can reach 15% because the specialty stacks high-dollar claims on complex coding and authorization rules. Four areas account for most preventable losses.
1. Modifier Errors
Modifier errors account for up to 18% of all orthopedic denials, and retrospective audits show practices lose 6% to 9% of collectible revenue annually to coding and modifier mistakes — at up to $165 per appeal and 14–21 days of payment delay. Build a payer-specific modifier matrix with documentation controls and audit it quarterly against AAOS guidance.
| Modifier | Clinical Use | Denial / Operational Trend | Documentation Control |
|---|---|---|---|
| 25 | Separate E/M same day as a minor procedure | Historically observed to trigger denials in roughly 35% of audits for missing independent assessments | Document a distinct exam, independent decision-making, and a separate treatment plan |
| 59 | Override NCCI bundling for distinct procedures | Frequently flags a 25% to 30% higher manual-review rate across major commercial payers | Op note must show separate anatomical sites, distinct incisions, or separate compartments |
| 22 | Increased procedural complexity | ~41% denied for failure to quantify added difficulty | Quantify added time, blood loss, or anatomical difficulty vs. a standard procedure |
| 50 | Bilateral procedure, same session | ~11% of outpatient denials; duplicate-billing and RT/LT errors | Verify whether the CPT is inherently bilateral; match payer-specific scrubbing rules |
| 51 | Multiple procedures, same session | Triggers payment reductions; errors cut allowable 7%–10% | Hardcode constraints to block application to add-on / 51-exempt codes |
| 58 | Staged/related procedure in global period | ~31% denied for missing staged-procedure documentation | Initial op note must state a future staged procedure is anticipated |
| 78 | Unplanned return to OR (related complication) | Extends payment ~24% when complication documentation is missing | Detail the complication, OR necessity, and explicit link to the initial surgery |
2. Prior Authorization Failures
An overwhelming majority of orthopedic ASC claims require prior authorization, and the specialty's authorization denial rate is routinely estimated by industry consultants at 25% to 35% — well above the averages seen in non-surgical specialties. The leading failure is the intraoperative procedure change: when a surgeon alters the approach or hardware based on findings, the final billed CPT codes no longer match the authorization on file, triggering automated denials. The billing team must update the authorization within 24 to 48 hours of surgery, before the claim goes out.
3. Medical Necessity and Conservative Treatment
Insufficient documentation of failed conservative treatment drives up to 70% of total-joint and spinal-fusion denials. Notes must carry date-, dosage-, and duration-specific evidence of 3 to 6 months of failed therapy — supervised PT or structured home exercise, targeted therapeutic injections, and supervised NSAID regimens. Vague statements like "patient tried conservative therapy without relief" fail AI-driven medical-necessity screens and trigger immediate rejection.
4. ICD-10 Specificity
Payer AI rejects unspecified codes outright. Submitting M17.9 (unspecified knee osteoarthritis) instead of M17.11 (primary osteoarthritis, right knee) triggers automated denial. Configure EHR templates to require 7th-character specificity for laterality and encounter type. EHR template optimization is the most durable fix here — it prevents the error at the point of documentation rather than catching it downstream.
The gold-carding opportunity
Practices that sustain prior-authorization approval rates of 90% or higher can qualify for gold-card status with certain commercial payers — bypassing standard authorization steps for qualifying procedures and reducing the administrative burden on high-volume approved cases. The path is a pre-service clinical validation workflow that attaches structured, date- and dosage-specific conservative-treatment evidence to every elective-surgery authorization, so automated payer review receives complete clinical data during the initial adjudication cycle.
How Orthopedic Leaders Should Use HFMA MAP Keys
The HFMA MAP Keys are 29 standardized KPIs across five domains — Patient Access, Pre-Billing, Claims, Account Resolution, and Financial Management — with consistent definitions that let a practice benchmark against national peers using the same math. For groups inside a larger health system, their value is definitional discipline: report orthopedic performance against MAP Key definitions at the service-line level, so a strong system-wide average can't mask an underperforming ortho line. Four keys deserve priority:
- Pre-Registration Rate (PA-2): scheduled encounters pre-registered before service — catches coverage lapses before care is delivered.
- Insurance Verification Rate (PA-3): encounters with electronic eligibility/benefits verification — real-time checks at scheduling and day-of-service cut eligibility denials sharply.
- Days in DNFB (PB-1): claims-generation timing — best practice 3–5 days; consistently above 5 signals op-note or coding bottlenecks.
- Total Charge Lag Days (PB-4): encounter-to-submission time — enforce a 24-hour chart-completion policy to protect cash velocity.
How to Segment AR by Payer and Provider
Segment AR aging by both payer category and individual provider. A single consolidated number conceals localized bottlenecks — slow payers, timely-filing risk, and credentialing lags on newly hired clinicians.
Payer Segmentation and Timely-Filing Risk
Separate self-pay from insurance AR, then split insurance into commercial, Medicare Advantage, Medicaid, and Workers' Comp — timely-filing windows range from restrictive 30-day commercial limits to 180- or 365-day Medicare limits. Work each aging bucket to a defined action.

| Aging Bucket | Operational Focus | Risk | Recommended Collection Action |
|---|---|---|---|
| 0–30 days | Confirm claim receipt and adjudication status | Minimal | Review clearinghouse rejections; correct front-end formatting/demographic errors |
| 31–60 days | Address soft denials; verify coordination of benefits | Low | Contact patients to resolve COB; re-verify secondary eligibility |
| 61–90 days | Resolve coding rejections and NCCI bundling edits | Moderate | Deploy certified orthopedic coders for targeted appeals using operative notes |
| 91–120 days | Initiate formal clinical appeals; peer-to-peer reviews | High | Escalate claims near filing limits; cite National Coverage Determinations |
| 120+ days | Forensic audit; route uncollectible self-pay to collections | Critical | Identify systemic payer delays; review WC cases (2–6% write-off risk past 180 days) |
Provider Credentialing Segmentation
A major source of high-dollar aging is the onboarding of new surgeons, PAs, and physical therapists. Billing before commercial and Medicaid credentialing is finalized leaves claims rejected or held indefinitely — and once they pass the timely-filing limits, the loss is permanent. Segmenting the aging report by billing provider lets leaders isolate credentialing-held claims, prevent premature submission, and hold credentialing coordinators accountable. Initiate credentialing 90 to 120 days before a clinician's start date.
The Four Revenue-Integrity Mandates for 2026
To insulate surgical margins from reimbursement compression and rising payer denials, practice leaders should execute four operational mandates now.
1. Shift Benchmarks from CCR to FPRR
Transition performance benchmarks from Clean Claim Rate to First Pass Resolution Rate, establishing a 90%+ first-pass target (95% representing top-decile) and auditing the baseline gap between the two metrics. A practice maintaining 98% CCR alongside 78% FPRR should optimize upstream workflows — real-time eligibility verification and automated pre-service authorization clearance.
2. Deploy a Modifier Validation Mechanism
Conduct quarterly reviews of high-volume modifiers (25, 59, 22, 58) against corresponding operative reports. Where documentation variance is identified, transition to structured, template-driven operative notes so clinical narratives fully justify the submitted modifiers.
3. Establish a 24-Hour Chart-Completion Standard
Monitor a 24-hour chart-completion standard aligned with HFMA MAP Key PB-4. Delayed operative reports directly increase Days in DNFB, restrict cash velocity, and extend DAR. Timely documentation remains the most effective operational mechanism for reducing charge lag and preserving cash-flow velocity.
4. Develop a Pre-Service Clinical Validation Workflow
Integrate discrete data fields within intake templates for elective joint and spine cases to systematically capture the precise dates, dosages, and durations of conservative therapies. Automatically appending this structured clinical history to prior-authorization submissions ensures automated payer review receives comprehensive data during the initial adjudication cycle — the same discipline that earns gold-card status.
What Is Urgent vs. What Is Emerging
⚡ Act Now (Q2–Q4 2026)
- Retire CPT 27445 from every template, charge sheet, and order set — it generates an automatic payer rejection on any submission.
- Master the 27278 vs. 27279 distinction and require operative notes to state explicitly whether the device pierces the cortices.
- Hardcode a site-of-service cross-check that reconciles the scheduled location with the active authorization 24–48 hours before incision.
- Switch your primary benchmark from CCR to FPRR and audit the gap between the two.
- Stand up the adjustment-to-charge ratio monitor (40%–55% target) and a $250 write-off governance rule to close the write-off trap.
- Enforce a 24-hour chart-completion standard to compress charge lag and DAR.
- Build the conservative-treatment intake fields (date, dosage, duration) for elective joint and spine cases.
- Initiate credentialing 90–120 days ahead of any new surgeon, PA, or PT start date, and segment AR by billing provider.
👁 Monitor and Prepare (6–18 Months)
- FHIR-based Prior Authorization APIs (January 1, 2027) — plan EHR/PM integration to automate documentation discovery and submission.
- Payer prior-auth metrics reporting (first cycle March 31, 2026) — use published approval/denial/turnaround data to inform escalation and contracting.
- Continued IPO list phase-out (full elimination by January 1, 2029) — model the ASC migration of additional MSK procedures.
- ASC Covered Procedures List expansion — re-evaluate which cases move to ASC settings and renegotiate facility contracts accordingly.
- Ambulatory Specialty Model (performance period begins 2027; ±9% Part B in 2029) — orthopedic surgeons treating low back pain face accountability; position care-coordination workflows now.
- Triennial efficiency-adjustment cycle — CMS applies the adjustment every three years; model future wRVU compression into multi-year forecasts.
- Gold-card qualification — track approval rates toward the 90% threshold with high-volume commercial payers.
Executive Checklist
| Action | Owner | Timeframe | Strategic Impact |
|---|---|---|---|
| Delete 27445; update charge master for CPT 2026 | Coding Lead / CDI | Immediate | Eliminates automatic rejections; protects SI-joint reimbursement |
| Adopt FPRR as primary benchmark; audit CCR–FPRR gap | RCM Director | 30 days | Surfaces real payment failures masked by clean-claim metrics |
| Implement site-of-service authorization cross-check | Pre-Auth / Mid-Cycle | 30–60 days | Prevents POS-mismatch automated denials on migrated cases |
| Stand up adjustment-to-charge monitor + write-off governance | Controller / CFO | 60 days | Recovers 3%–5% of revenue lost to mis-booked write-offs |
| Enforce 24-hour chart-completion standard (PB-4) | Surgeons / Practice Mgr | Ongoing | Cuts DNFB and DAR; frees ~$137K per 10-day reduction |
| Build conservative-treatment intake fields for elective cases | CDI / EHR Analyst | 60–90 days | Reduces medical-necessity denials; path to gold-carding |
| Quarterly modifier audit (25, 59, 22, 58) vs. op notes | Coding / Compliance | Quarterly | Recovers 6%–9% of collectible revenue lost to modifier errors |
| Segment AR by payer and provider; initiate early credentialing | AR Manager / Credentialing | Ongoing | Isolates timely-filing and credentialing-hold risk before it ages out |

Frequently Asked Questions
What is driving the 2026 reimbursement compression for orthopedic practices?
Three regulatory shifts converged on January 1, 2026: a –2.5% efficiency adjustment to the work RVUs and intra-service time of most non-time-based codes (the surgical, interventional-pain, and imaging services that drive orthopedic revenue); a site-of-service practice-expense realignment that cuts facility-setting PE and penalizes hospital-based surgery; and the CMS-0057-F prior-authorization rule's compressed decision timelines, which have pushed commercial payers toward automated adjudication. Even though the CY 2026 conversion factors rose to $33.57 (QP) and $33.40 (non-QP), the efficiency adjustment lands on base work RVUs, so the net weighted impact for orthopedic providers is closer to a 1.5% decrease.
What is the CY 2026 Medicare efficiency adjustment and how does it affect orthopedic revenue?
The efficiency adjustment is a –2.5% reduction finalized by CMS in the CY 2026 Physician Fee Schedule (CMS-1832-F) to the work RVUs and intra-service time of nearly all non-time-based codes, on the theory that efficiencies accrue over time. Because it deflates the base wRVUs rather than the conversion factor, it erodes per-case profitability on surgical work even as conversion factors rise. For a practice with $5 million in Medicare-allowable surgical charges, the baseline wRVU compression is roughly $125,000 per year before any denial. Time-based codes — E/M, care management, behavioral health — are exempt, and CMS applies the adjustment on a three-year cycle.
What are the most important orthopedic RCM KPIs to track in 2026?
Seven KPIs form the objective baseline: Net Collection Rate (target 98%–100%), Revenue Realization Rate (99%–100%, calculated 90 days in arrears), Days in AR (under 35, elite under 30), Billed A/R over 90 days (under 10%), Clean Claim Rate (97%+, elite 99%), First Pass Resolution Rate (90%+, elite 95%), and Denial Rate (under 5%, elite under 3%). These map to HFMA MAP Key domains and MGMA/HBMA standards. FPRR is the gold standard because it tracks claims all the way to payment, while clean claim rate stops at submission.
Why is first pass resolution rate more important than clean claim rate?
A claim can pass every formatting edit (a clean claim) and still be denied for prior authorization, medical necessity, or eligibility. Clean Claim Rate stops at submission; First Pass Resolution Rate tracks the claim all the way to payment with no rework. A well-configured scrubber can show a 98% CCR while FPRR sits at 78%, and that gap is where revenue leaks — especially because a substantial share of denied claims (commonly cited around 35%, sometimes up to 60%) are never resubmitted. Manage to FPRR with a 90%+ target and 95%+ as best practice, and treat CCR as an upstream control rather than the finish line.
What is the write-off trap and how does it inflate net collection rate?
The write-off trap is the misclassification of administrative write-offs — permanent losses from timely-filing lapses, missing authorizations, or unworked denials — as contractual adjustments. Because NCR is total payments divided by net charges (gross minus contractual adjustments), shifting a loss into the contractual column shrinks the denominator, reporting a 100% collection rate on a claim that collected nothing. It is estimated to cost 3% to 5% of annual collectible revenue. Catch it by monitoring the adjustment-to-charge ratio (40%–55% for a commercial-heavy orthopedic mix); an unexplained spike signals collectible claims being written off. Enforce supervisor approval for any non-contractual write-off above a set threshold.
What CPT 2026 code changes affect orthopedic practices the most?
CPT 2026 carries 418 changes (288 new, 84 deleted, 46 revised) concentrated in musculoskeletal and spinal services. The five highest-priority for orthopedics: new all-inclusive limb-lengthening codes 27458 (femur) and 27713 (tibia/fibula); revised SI-joint arthrodesis codes 27278 (intra-articular, no cortical piercing) and 27279 (transarticular, piercing cortices, now including hybrid fusions); new lumbar annular-repair add-on 63032; new Category III thumb-base arthroplasty code 1003T; and the deletion of 27445 (hinge prosthesis knee arthroplasty). Templates must be revised immediately to avoid automated rejection.
Why was CPT 27445 deleted and what happens if I bill it in 2026?
CPT 27445 (primary hinge prosthesis knee arthroplasty) was deleted from the CPT 2026 set because the procedure is clinically obsolete — the hinge prosthesis has been off the market for decades. Any submission of 27445 with a 2026 date of service results in an automatic payer rejection. Remove it from every template, charge sheet, and order set now, and confirm your EHR and clearinghouse edits flag it.
What are the top orthopedic claim denial reasons and how do you prevent them?
Four areas account for most preventable orthopedic losses: modifier errors (up to 18% of denials — build a payer-specific modifier matrix audited quarterly against AAOS guidance); prior-authorization failures, especially intraoperative procedure changes that desync billed codes from the authorization (update the auth within 24–48 hours of surgery); medical-necessity gaps, where vague conservative-treatment notes drive up to 70% of total-joint and spinal-fusion denials (document date-, dosage-, and duration-specific failed therapy); and ICD-10 specificity, where unspecified codes like M17.9 are rejected outright (require 7th-character laterality and encounter-type specificity in EHR templates).
What is gold-carding and how do orthopedic practices qualify?
Gold-carding allows practices that maintain prior-authorization approval rates at or above 90% to bypass standard authorization steps for qualifying procedures with certain commercial payers, reducing administrative burden for high-volume approved cases. Practices qualify by building a pre-service clinical validation workflow that attaches structured, date- and dosage-specific conservative-treatment evidence to every elective-surgery authorization, so automated payer review receives complete clinical data during the initial adjudication cycle and sustains high approval rates.
How do the CMS-0057-F prior authorization timelines affect orthopedic practices?
Effective January 1, 2026, the CMS-0057-F rule requires impacted payers — Medicare Advantage, Medicaid managed care, and CHIP managed care — to decide complete prior-auth requests within 72 hours for urgent cases and 7 calendar days for standard ones, and to give specific denial reasons regardless of submission method. Payers must publicly report prior-auth metrics starting March 31, 2026, and implement FHIR-based Prior Authorization APIs by January 1, 2027. The practical effect for orthopedics is that complete, payer-specific clinical documentation must go in on the first pass; incomplete front-end documentation increasingly triggers automated denials within the compressed window.
What is a site-of-service mismatch denial and how do you prevent it?
A site-of-service mismatch occurs when a prior authorization is secured for one place of service — for example, an inpatient setting (POS 21) — while the procedure is actually performed in an ASC (POS 24). The discrepancy triggers an immediate automated denial that is exceptionally difficult and costly to overturn on retroactive appeal. As CMS's IPO-list phase-out and ASC list expansion push more orthopedic cases outpatient, this becomes the most common new leak. Prevent it by hardcoding an automated cross-check that reconciles the scheduled service location against the active authorization 24 to 48 hours before incision.
How should orthopedic practices segment accounts receivable?
Segment AR by both payer category and individual billing provider. Separate self-pay from insurance, then split insurance into commercial, Medicare Advantage, Medicaid, and Workers' Comp, because the timely-filing windows range from 30-day commercial limits to 180- or 365-day Medicare limits. Work each aging bucket to a defined action, escalating clinical appeals at 91–120 days before claims hit filing limits and routing 120+ day balances to forensic audit or collections. Segmenting by provider isolates credentialing-held claims on newly hired surgeons and therapists — bill before credentialing is finalized, and the claims are held or rejected, and once past timely filing, the loss is permanent. Initiate credentialing 90 to 120 days before a clinician's start date.
The Bottom Line
The orthopedic practices that stay financially strong into 2027 treat revenue cycle management as a strategic asset, not a back office. They absorb the 2026 reimbursement cuts by tightening the controllable levers — measuring against MAP Key definitions, managing to FPRR rather than clean claim rate, cross-checking NCR against the adjustment-to-charge ratio, updating coding templates for the new CPT and site-of-service realities, and segmenting AR finely enough to catch a credentialing lag or a single problem payer before it bottlenecks cash.
None of the macro pressures are negotiable: the efficiency adjustment, the facility PE realignment, and the compressed prior-auth windows are fixed inputs. What remains within the practice's control is the gap between a clean claim and a paid one, the integrity of the write-off ledger, the precision of the operative note, and the speed of the chart. Those are the levers that separate a top-decile orthopedic book from an average one.
In a surgery-heavy specialty, per-case precision is the margin. Benchmark your own numbers against your payer and case mix first — then close the gap to top-decile, one KPI at a time.
Protect Your Orthopedic Margins in 2026
Revele works with orthopedic groups, surgical specialty practices, and physician organizations on the specific revenue cycle work this analysis demands — CPT 2026 charge-master updates, modifier validation, site-of-service authorization cross-checks, FPRR optimization, denial reduction, and AR segmentation tuned to surgical billing logic.
Revele has recently unlocked its acclaimed RISE Program to all medical practices and specialty groups.
Disclaimer: The content published by Revele is provided for informational and educational purposes only and does not constitute legal, medical, financial, or tax advice. Healthcare laws, payer policies, coding rules, and compliance standards are highly complex and subject to frequent change. While Revele makes every effort to ensure the information shared is accurate and current at the time of publication, we make no representations or warranties, express or implied, regarding the completeness or accuracy of this information.
Readers and users must consult with qualified professionals, certified coders, regulatory authorities, or independent legal and financial advisors for advice specific to their individual circumstances before making any strategic, clinical, coding, or operational decisions.
This analysis reflects confirmed regulatory and coding developments through June 2026. Benchmark ranges reflect MGMA, HFMA MAP Keys, and HBMA standards, as well as 2025–2026 orthopedic RCM reporting. Primary sources include the CY 2026 Medicare Physician Fee Schedule Final Rule (CMS-1832-F), the CY 2026 OPPS/ASC final rule, the AMA CPT 2026 code set, the CMS Interoperability and Prior Authorization Final Rule (CMS-0057-F), and the One Big Beautiful Bill Act (Public Law 119-21). All figures are starting points; validate against your own payer mix, case mix, and trended performance.