Clinical Coding
Identify risks, shorten the revenue cycle, and drive improvements with clinical documentation education.


Practice Performance Report
Get a monthly snapshot into practice performance with a customized dashboard and in-depth data on practice performance metrics like charges, payments, AR, payer mix, provider production, and more. Our custom Practice Performance Report comes standard with Revele RCM.
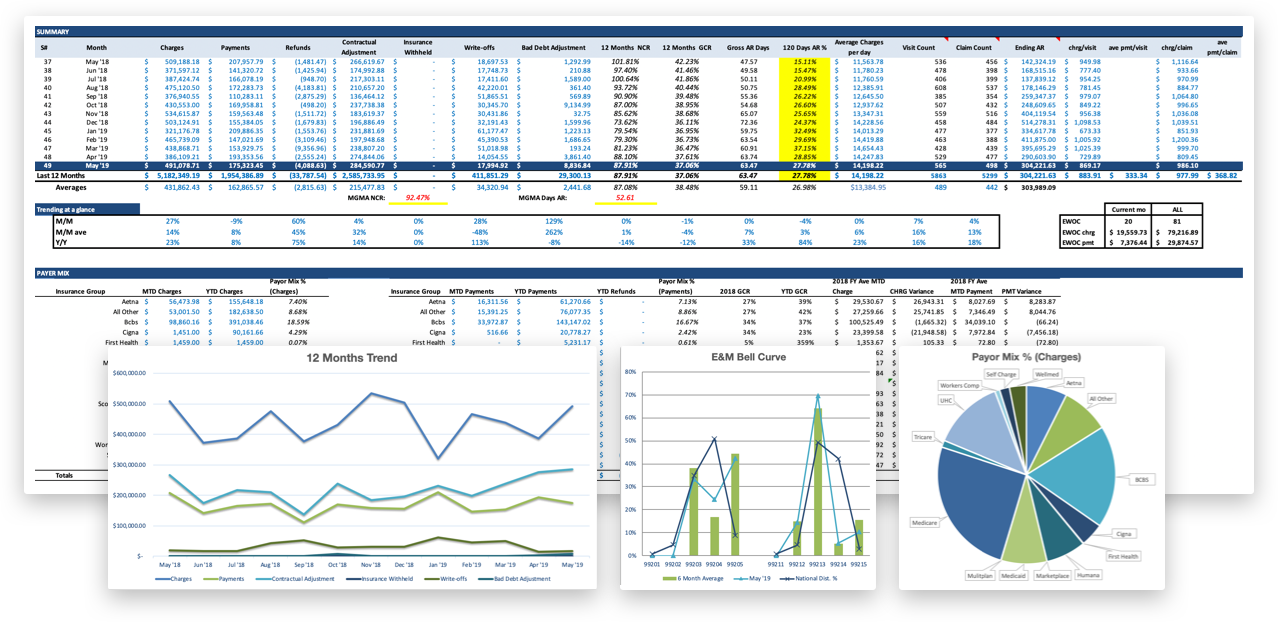

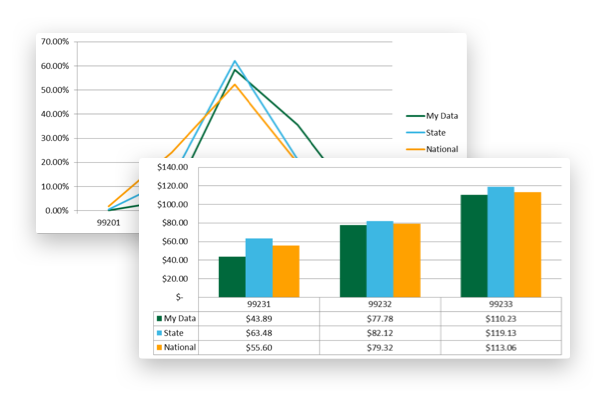
Compare your practice data to your peers’ data and determine exactly where your organization needs improvement. Harness remittance data of more than 400,000 providers to configure various reports to benchmark your performance with your peers by state, national averages, and specialty.
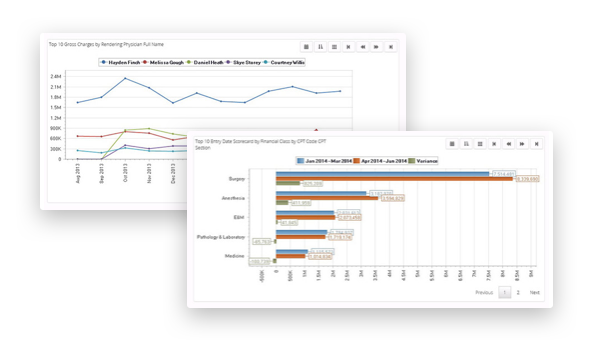
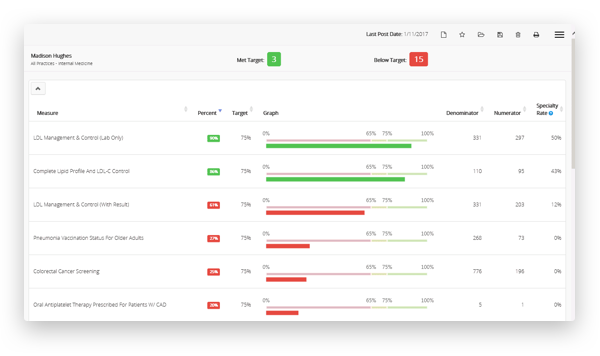
Dashboards provide timely feedback that can motivate employees, maintain workflows, and keep everyone focused on the operations that impact the bottom line. Revele Healthcare Analytics automatically collects data from multiple sources making it easier for you to measure, analyze, and monitor Key Performance Indicators (KPIs) in a format that is both interactive and insightful. Select from a variety of reports including trends and projections to fully customize a personal or shared dashboard.

In-depth analytics doesn’t have to be complicated. With an ad hoc reporting and analysis tool, you have the flexibility to search and refine your data by simply dragging and dropping performance measures and data filters. Creating analysis reports is logical and intuitive while in-depth analytics can easily be done without having to collect and aggregate data manually.
Calculate practice profitability by profit centers grouped by division, practice, provider, facility, specialty or an ancillary service or procedure
Ensure claims are paid correctly with flagged underpayments and overpayments
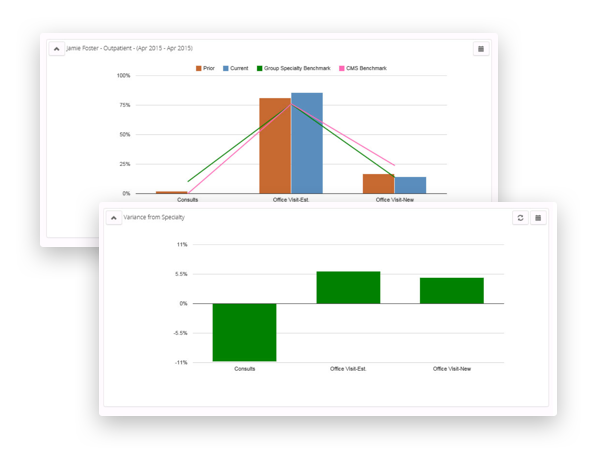
Compare E&M Coding with CMS Benchmarks
Quantify “what if” scenarios and identify revenue opportunities
Save time, avoid errors, and eliminate tedious work with advanced population health management and clinical analytics.
Traditional medical billing fails to think forward. The future of healthcare is changing and those that lead it need new ways to integrate data, standardize processes and reinvent the revenue cycle for tomorrow and beyond.
